What are Lag Metrics?


“Lag” metrics are defined as aggregated data that is measured over time and demonstrates the impact of the work over time.
Determining and tracking the right metrics are vital for any analytical process and can be broken down into two types: lead metrics and lag metrics.
Lag metrics should be demonstrated in a dashboard that shows results based on preset dates and could include:
- Number of page views per date.
- Number of screen views per date.
- Names of pages per date.
- Names of screens per date.
- Sources (i.e. direct, google or duckduckgo) per date.
- Number of active users per date.
- Locations of active users per date.
- Number of members (i.e. logged in) per date.
- Number of non-members (i.e. not logged in) per date.
- Number of new accounts created per date.
- Number of impressions per date.
- User engagement per date.
- Clicks per date.
- Scrolls per date.
- User reached the end of the page per date.
- User subscribed per date.
- User unsubscribed per date.
- Incomplete sales per date.
- Sales made per date.
- Contact request per date.
- Support request per date.
Dashboard designs for lag metrics that could be of interest include:

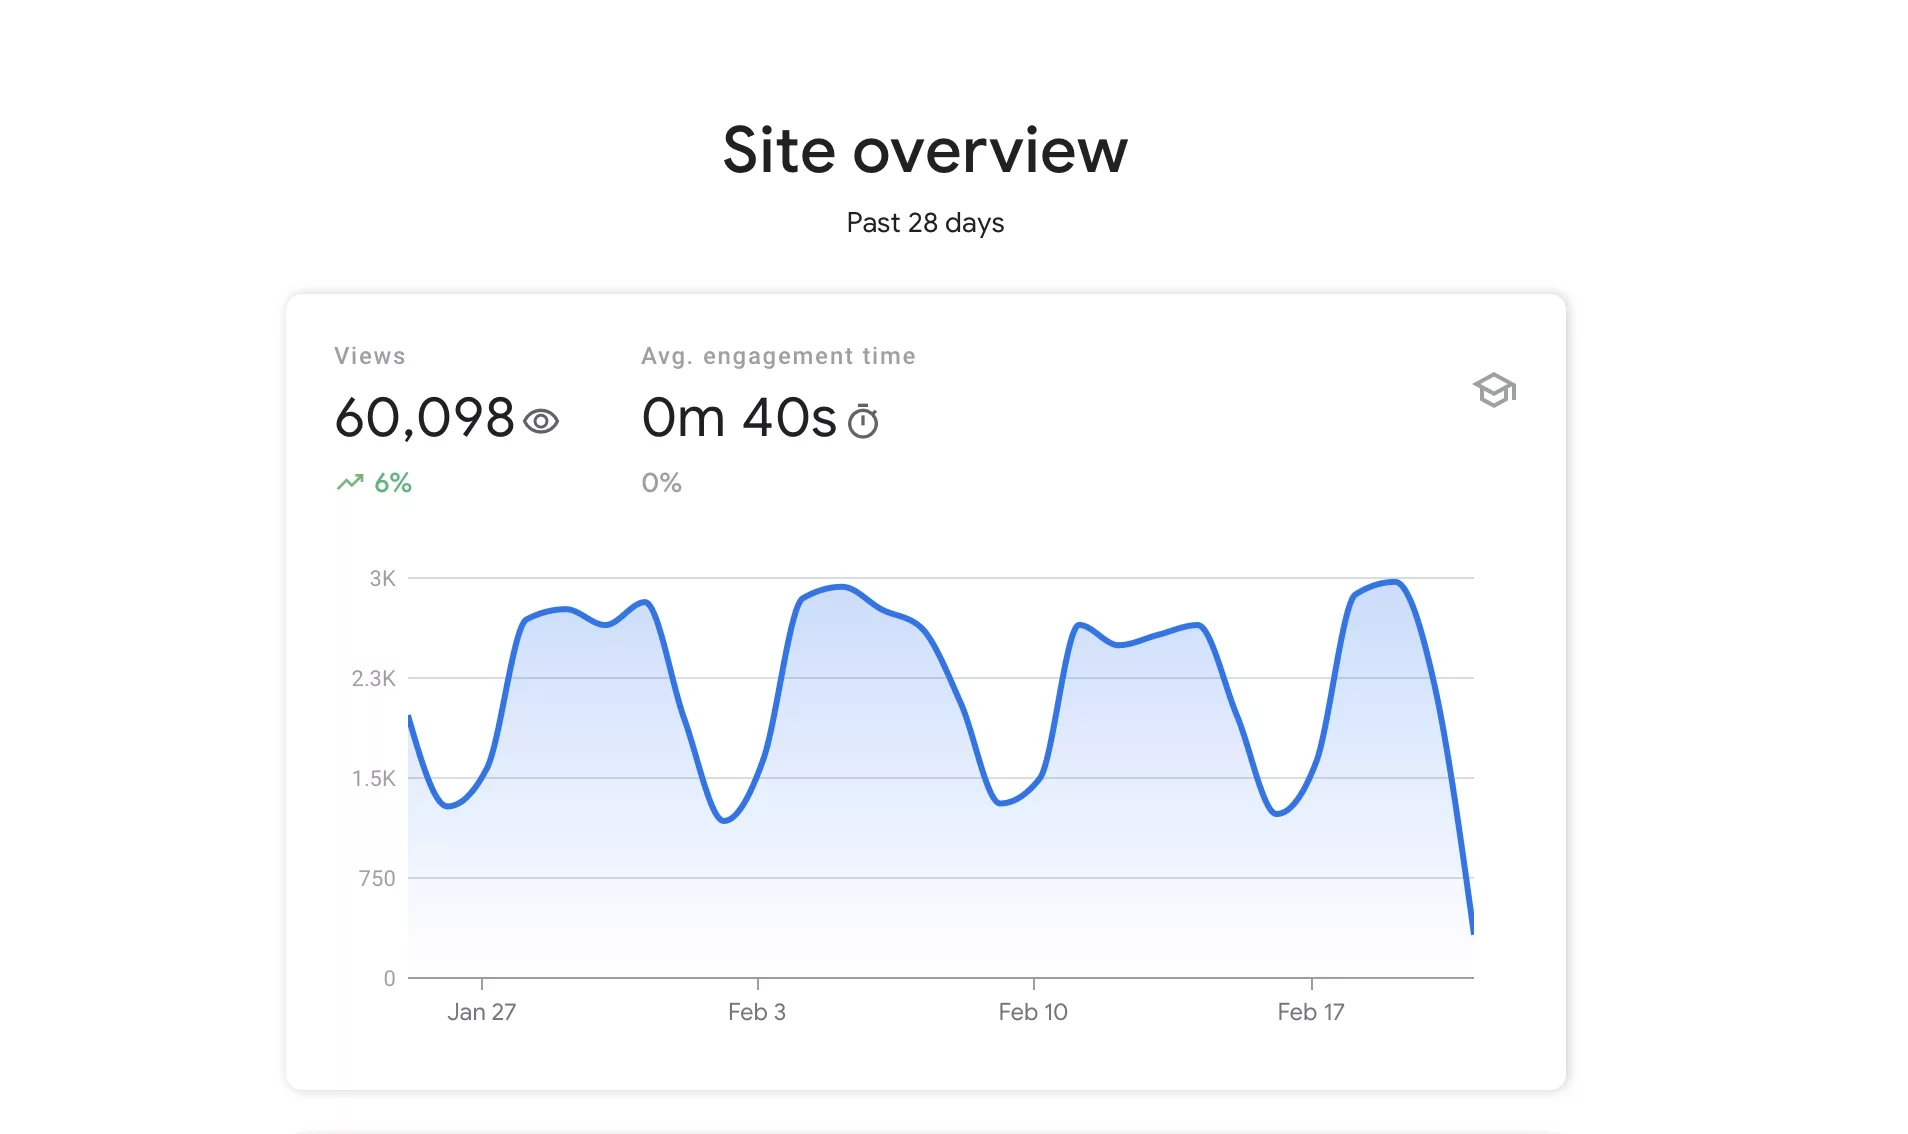
Google Analytics Page Views for the last 28 days.

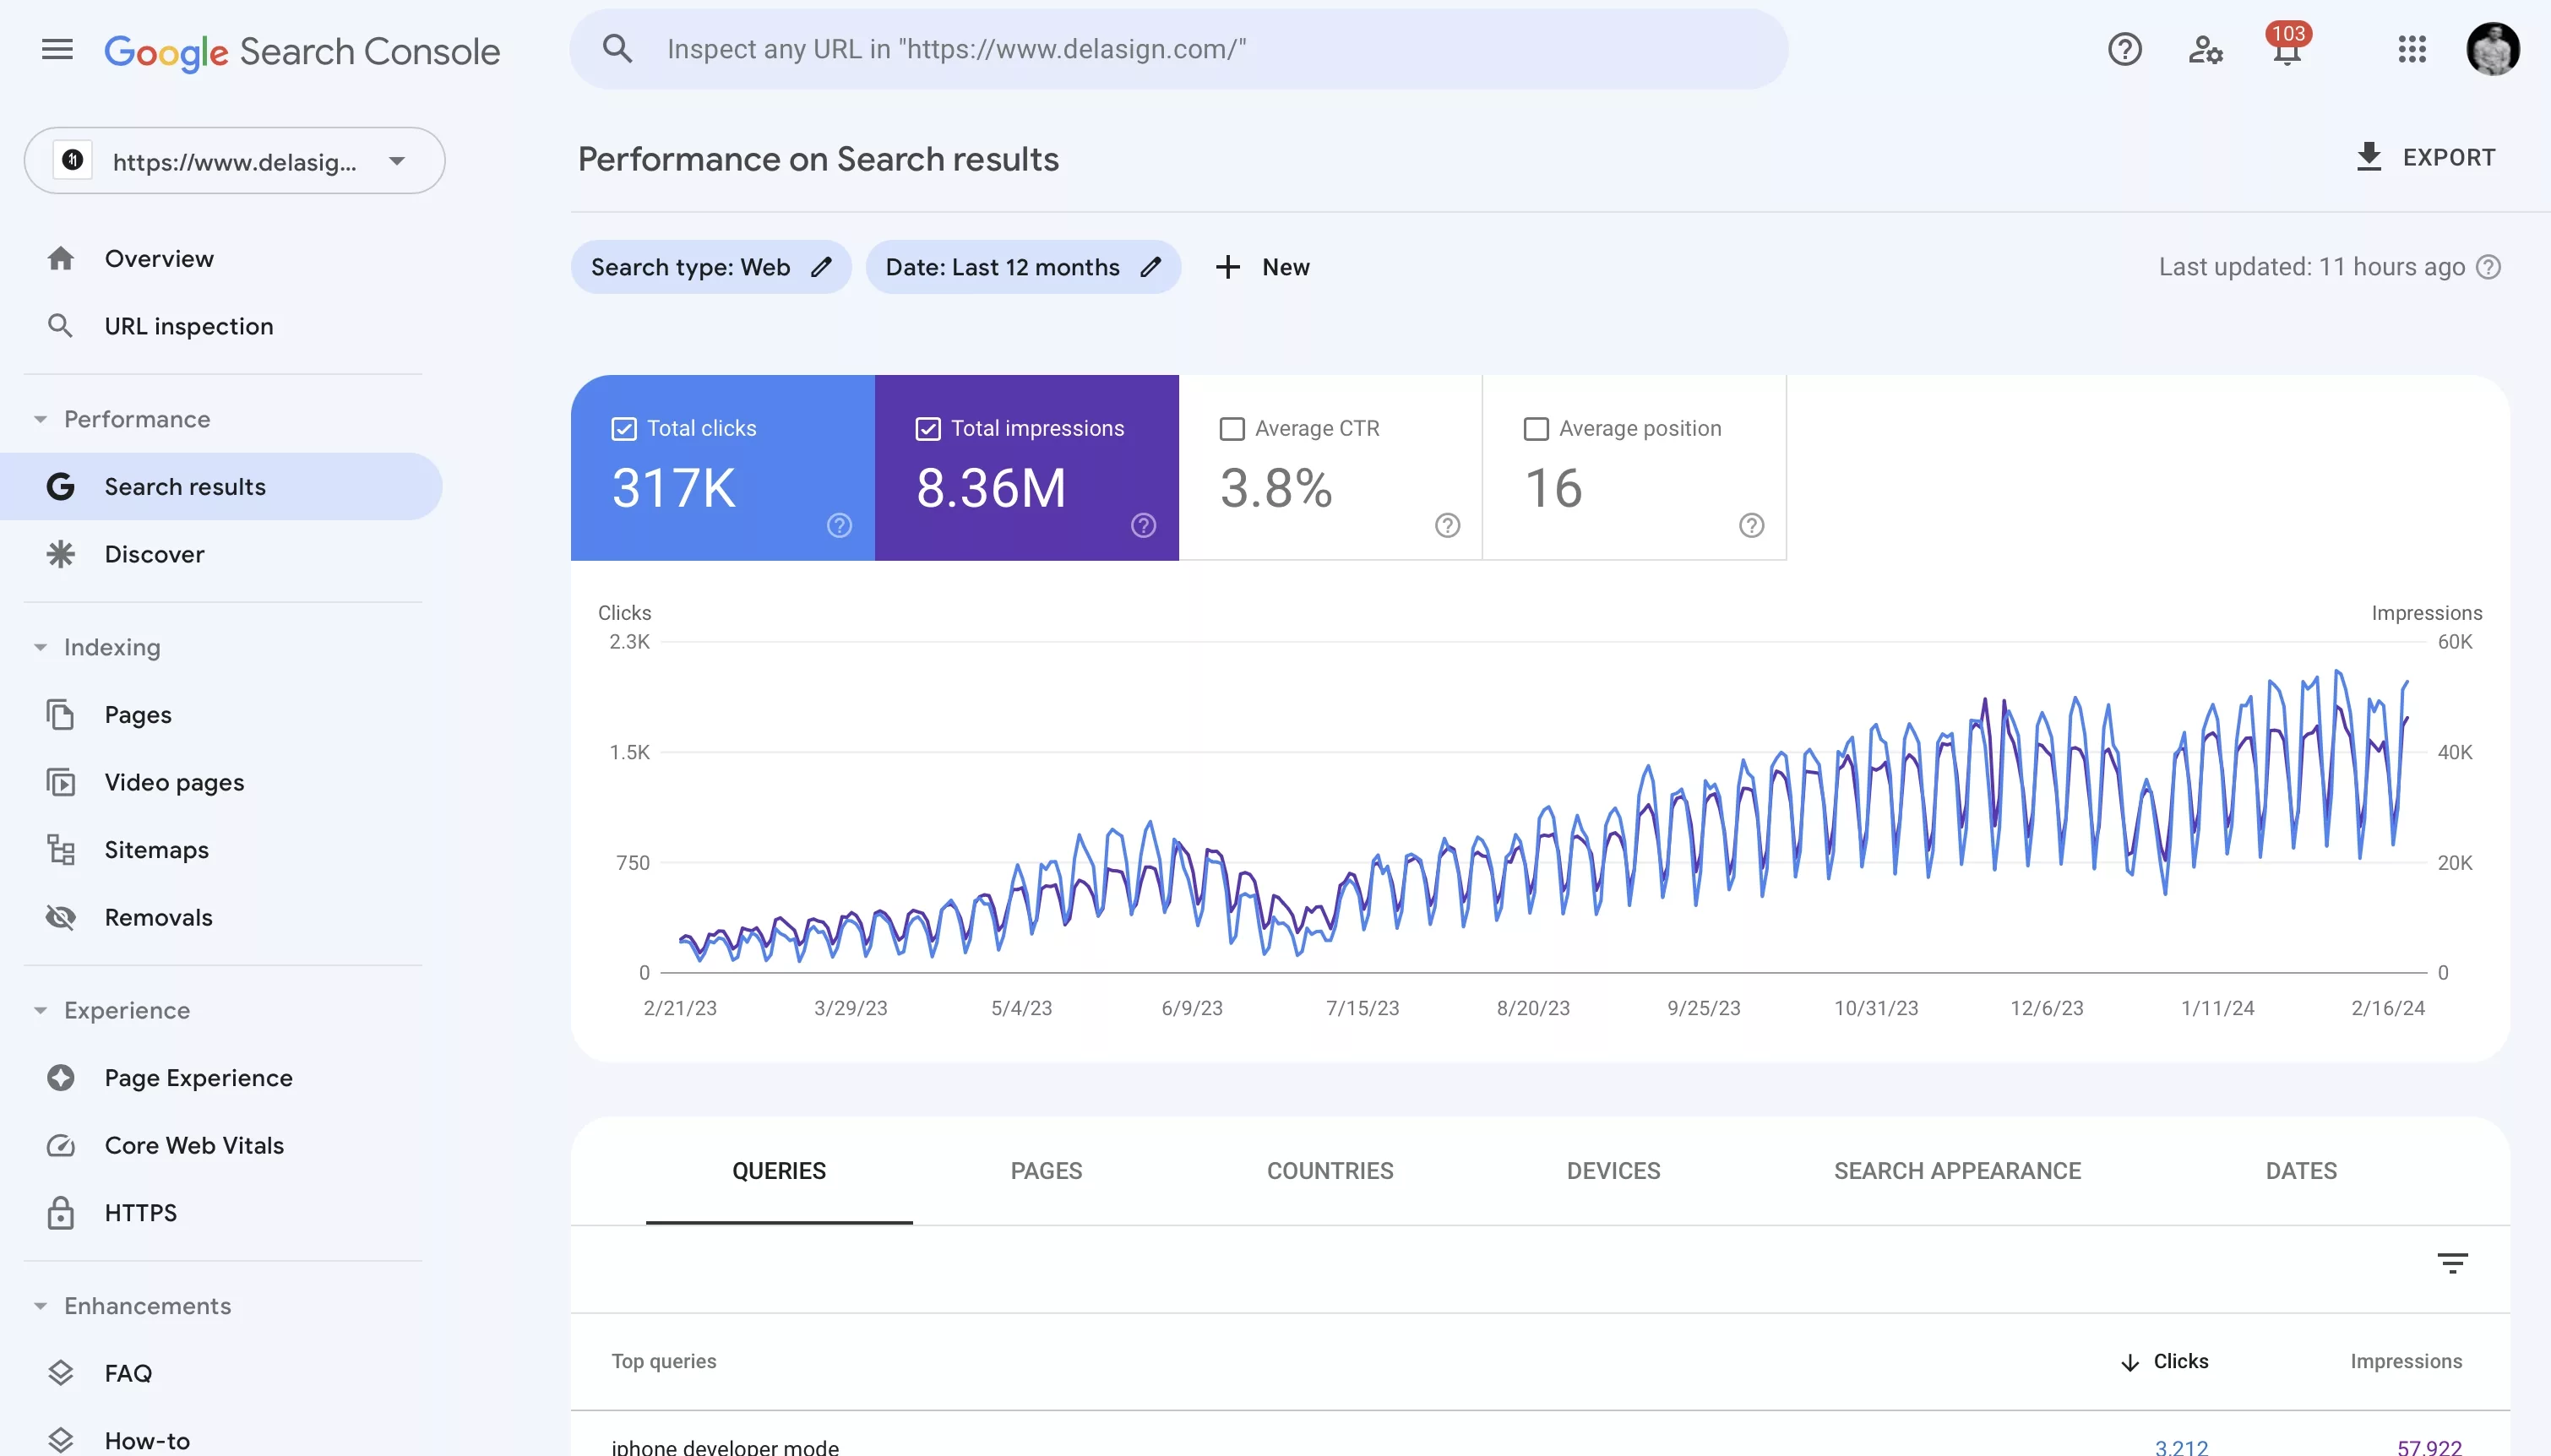
Google Search Console Performance over the last year.

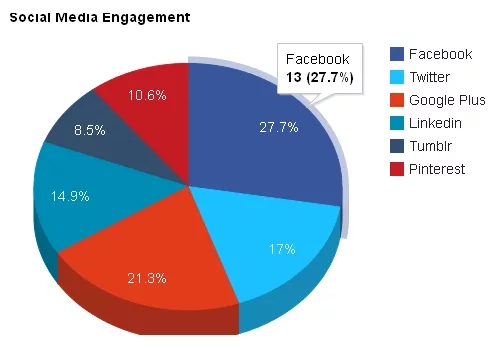
A pie chart showing social media engagement over a preset amount of time.
Looking to learn more about Analytics, Strategy or Technology?
Search our blog to find educational content on analytics, strategy, technology and development.
