How to view logs from Lambda functions in AWS
A step by step tutorial on consulting console logs from Lambda functions using AWS CloudWatch log streams.

A step by step tutorial on consulting console logs from Lambda functions using AWS CloudWatch log streams.
The following tutorial walks you through how to check the log stream of a Lambda function on AWS through AWS Cloudwatch. The tutorial uses the API that we produced as part of our Open Source Serverless & Typescript series, which are accessible through the links below.
Step One: Login to AWS
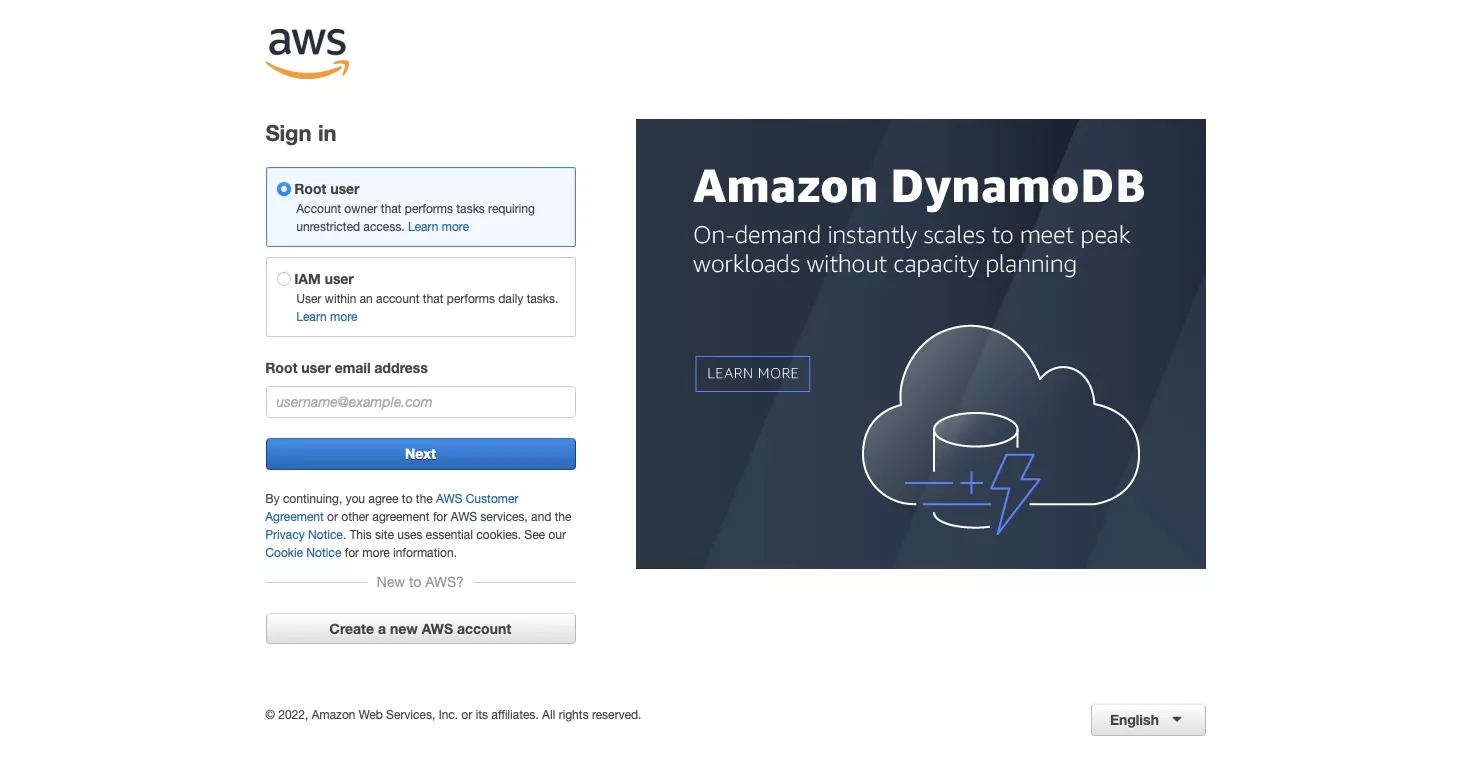
Go to aws.amazon.com and login to the account whose logs you are seeking to consult.
Step Two: Navigate to Lambda
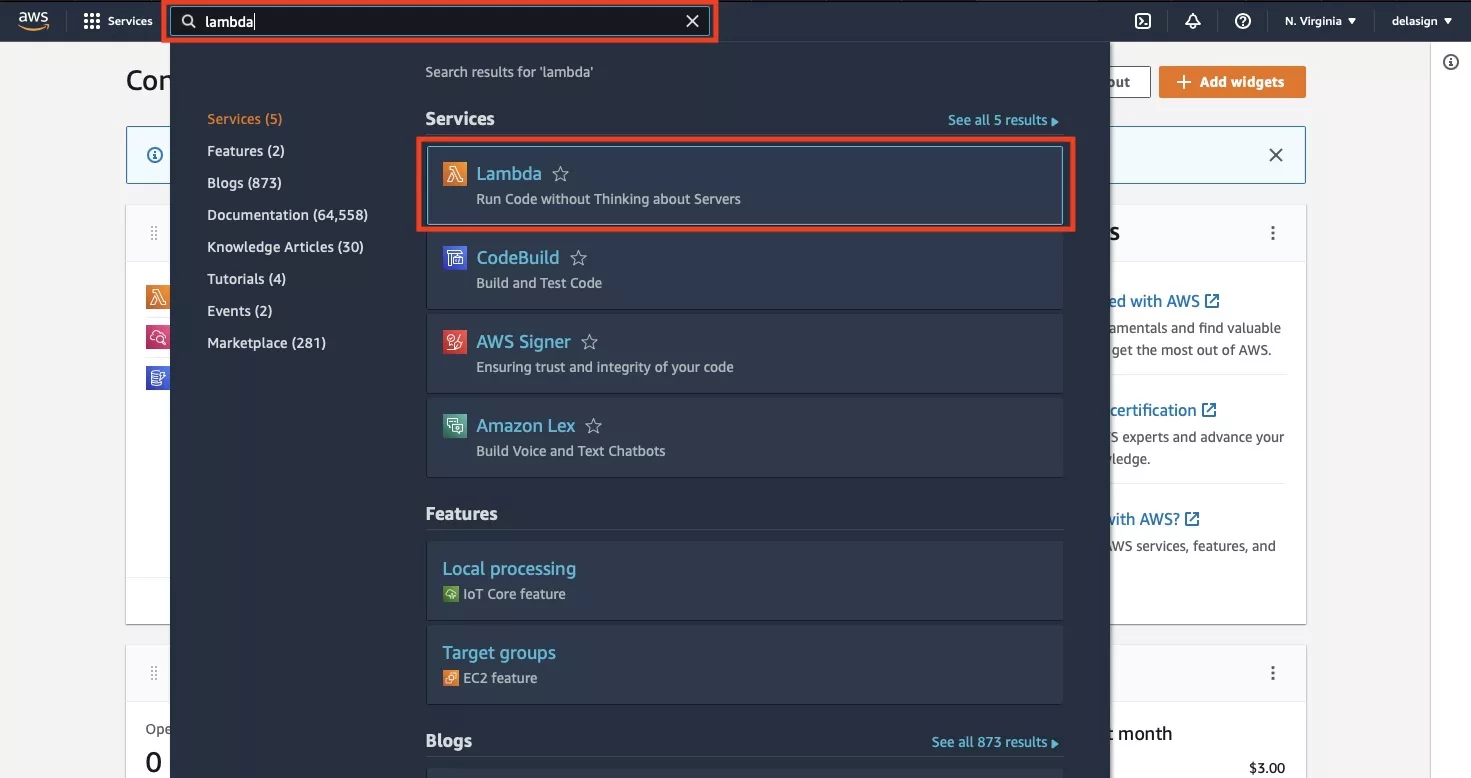
Using the AWS search bar at the top of the website, search for Lambda. When it appears in the search menu, select it to navigate to the AWS Lambda capability.
Step Three: Search for the function
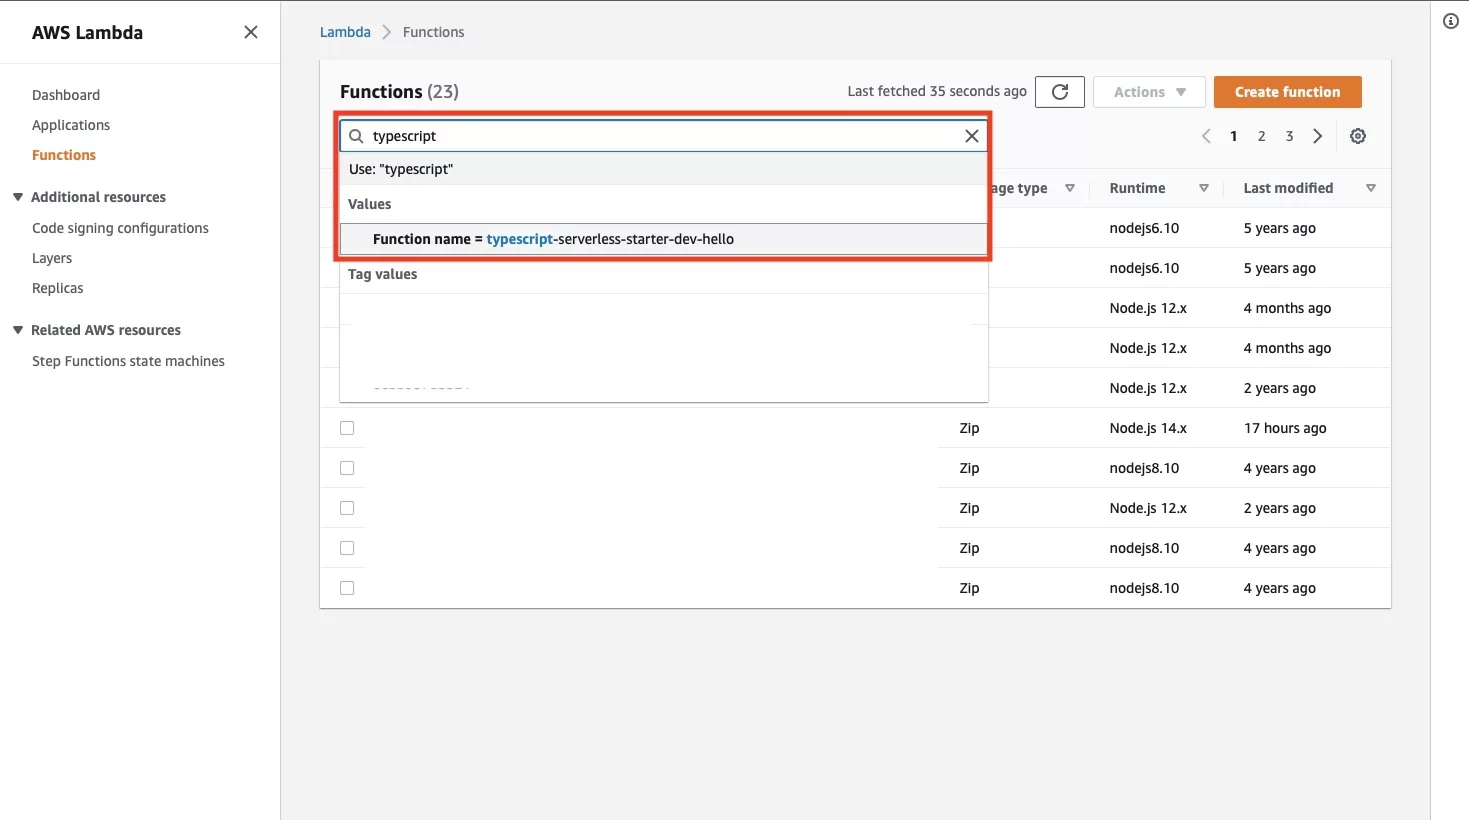
Using the AWS Lambda search bar, search for the function that you are seeking to consult the logs for. When it appears, select it.
Step Four: Select Monitor
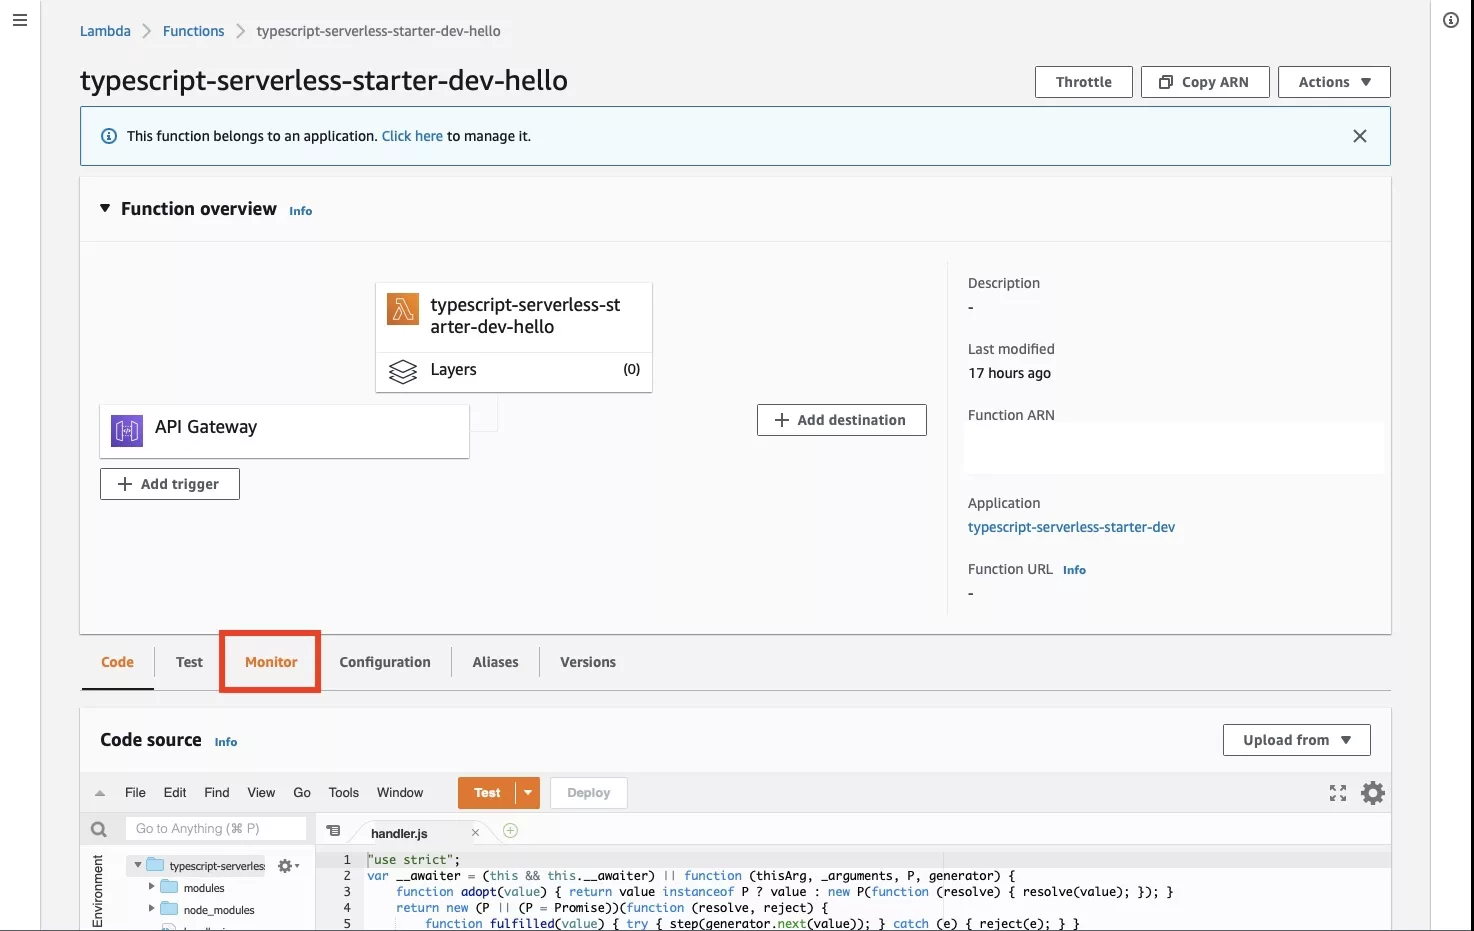
From the menu below the Function Overview, select Monitor.
Step Five: Select View logs in Cloudwatch
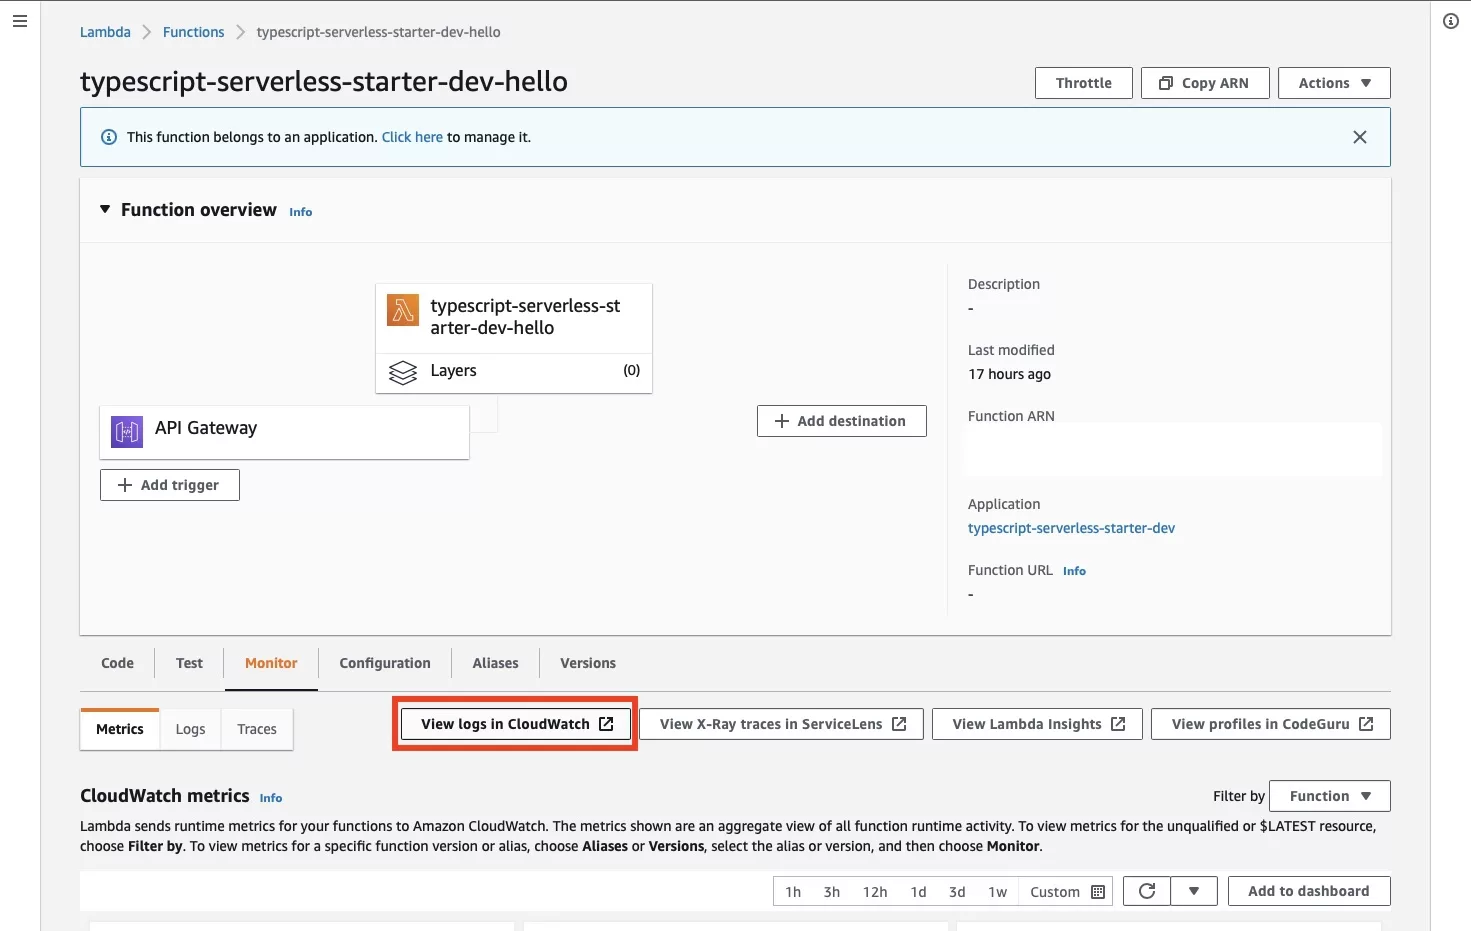
In the layout that appears, select View logs in Cloudwatch.
Step Six: Select a log
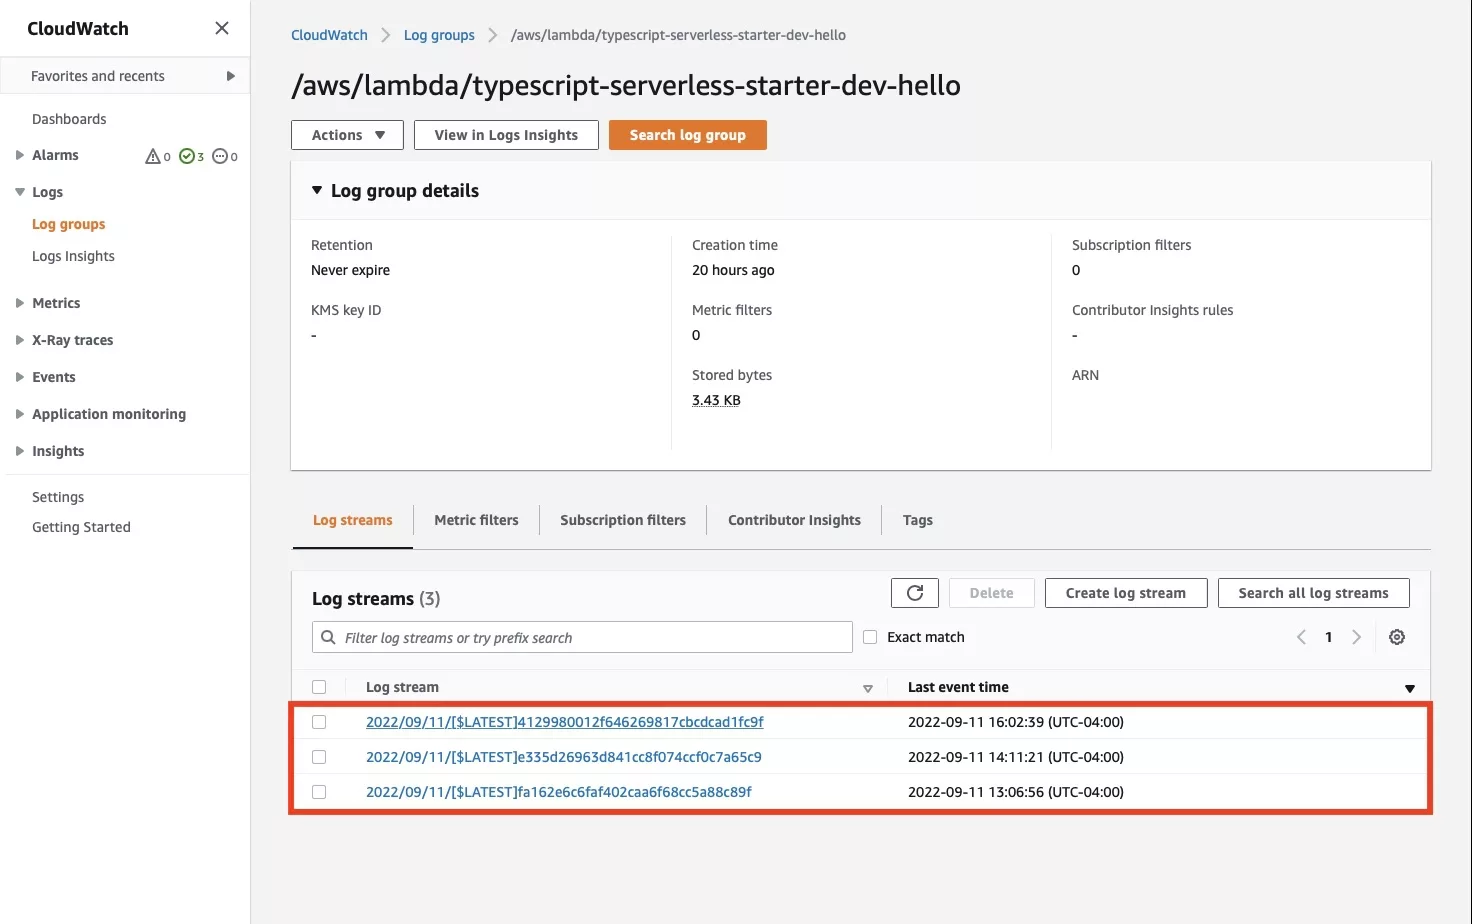
In the page that appears, you will be able to consult all the log streams for the AWS Lambda function. These are broken down by events. Select the log stream that you wish to consult.
Step Seven: Analyze
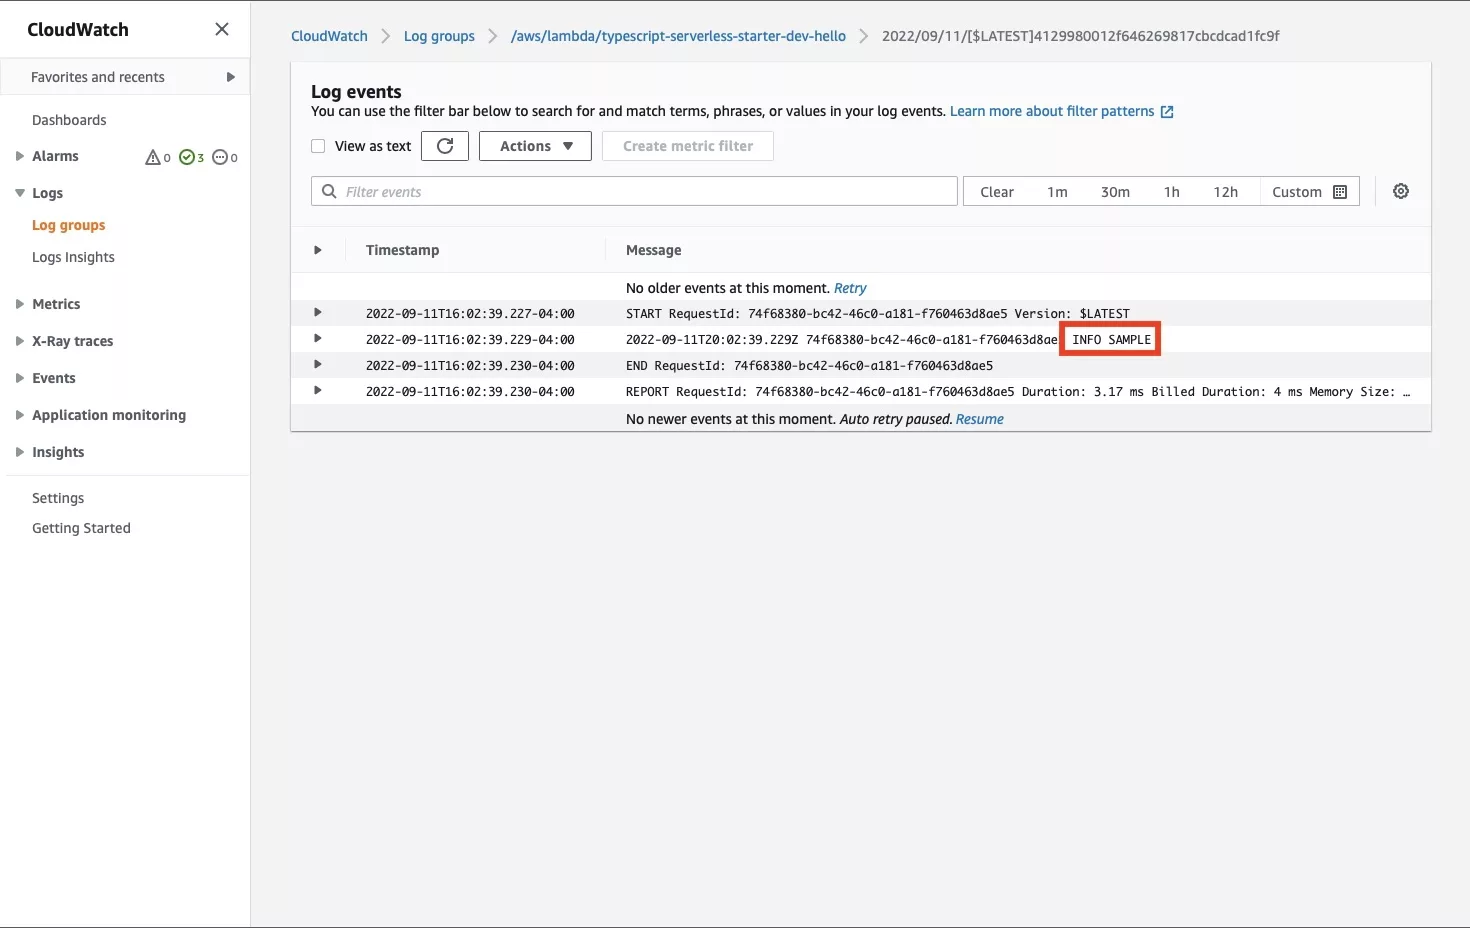
The page that appears shows the logs that were generated for an event (i.e. someone called the API) for that AWS Lambda function. As you can see from the screenshot above, this Log Stream logged our sample log that we generated as part of our proof of concept for alias paths in Serverless & Typescript.
Any Questions ?
We are actively looking for feedback on how to improve this resource. Please send us a note to inquiries@delasign.com with any thoughts or feedback you may have.